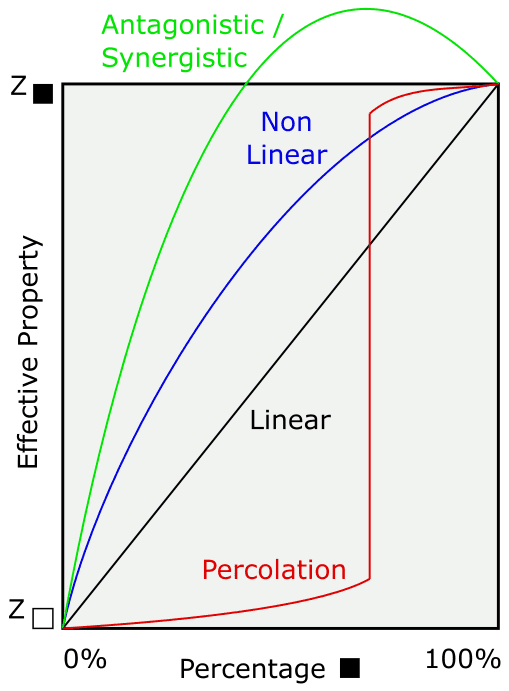
Consider the sketch that shows four possible averaging behaviours with a simple binary mixture of white rock and black rock.

The effective property of 100% white is that of white rock (the lower left); if 100% black the effective property is that of black rock (the upper right). If the rock property averages linearly, then mixtures would take a mass or volume weighted average (the black line). Many rock properties like mass fractions, volume fractions, thickness and position average linearly. Nonlinear averaging is illustrated by the blue line; a 50/50 mixture would not act like half white and half black – one rock type would have more influence on the effective property. This is common with variables such as recovery and throughput. In special circumstances, the effective property can go outside the range of the two pure components – illustrated by the green antagonistic/synergistic line. This would depend on specific chemical reactions or increased efficiency of a mixture relative to a pure component, for example, performance of a semi-autogenous grinding (SAG) mill. In flow, it is common to see a percolation phenomenon (the red line) where the behaviour is dominated by one component until a critical threshold where the behaviour is abruptly dominated by the other component. Consider the permeability of a mixture of permeable and impermeable rock. A small amount of permeable rock in an impermeable matrix does not have much influence on the impermeable nature of the rock. There reaches a critical threshold in the percentage of the permeable component, however, where there are connected pathways through the mixture. The impermeable rock is now a baffle to flow in a permeable mixture.
This sketch is a simple way to illustrate the different nature of averaging behaviour. In practice (1) we frequently do not have a binary mixture - there may be many components combined, (2) the rock properties are not constant for each component, and (3) the mixing behaviour may be more complicated. We divide variables into linear and nonlinear. Nonlinear variables include the antagonistic/synergistic, percolation and other behaviours. Nonlinear variables such as geometallurgical performance variables, geomechanical rock properties and rate constants are encountered increasingly in geostatistics. There are questions about how to proceed in presence of nonlinear variables.
Exploratory data analysis proceeds the same for linear and nonlinear variables. Nonlinear variables tend to be sampled less and the samples may not be representative of the entire domain being considered. Kernel density estimation or Gaussian mixture models (GMM) may be considered to manage the small number of data. Declustering and debiasing are carefully considered to manage representativity and bias in sample selection. Large scale trends are modeled the same for linear and nonlinear variables. Removing the trend with a GMM (see previous discussion on Trends in Geostatistics) is the same. Moreover, the spatial continuity of a regionalized variable is understood, with variograms of the original units and normal scores being the same for linear and nonlinear variables.
Kriging and virtually all estimation techniques including inverse distance and most variants of machine learning, implicitly assume linear averaging. There is an inevitable smoothing toward the mean. A kriged model of a nonlinear variable could be used to visualize spatial structure, but would be biased for any subsequent engineering calculations. In certain cases, the nonlinear variable could be transformed to appear linear by, for example, a power law transform. The transformed variable could be kriged, then back transformed. In general, estimation is not suitable for nonlinear variables.
The best approach is to simulate all available linear and nonlinear variables in a multivariate manner respecting the spatial and multivariate relationships among them. There is no averaging in simulation. Kriging is used to infer conditional distributions or for conditioning. The data-scale realizations represent the joint variability and uncertainty in all variables. The calculation of effective properties is reserved until the last possible moment. If possible, the correct averaging schema is used (for example, the pressure equation for permeability or experimentally determined geometallurgical mixing behaviour). If necessary, an empirical relationship derived from extensive test work is used.
When the nonlinear variables are sparsely sampled the linear intrinsic rock properties could be modeled with geostatistics, then a response surface model could be applied to give predictions of the nonlinear variables. This is applicable, for example, when there are few geometallurgical tests and many more drill holes with conventional grade measurements.
Resource Modeling Solutions Ltd focuses on workflows and a software platform for multivariate simulation of many rock properties and model post processing in a manner consistent with the linear or nonlinear nature of the rock properties.


