The variogram range is commonly considered to be the distance at which the variogram reaches the sill variance. This blog highlights that the variogram range is a very ambiguous parameter. It is sensitive to decisions in variogram modeling. The entire variogram shape defines spatial continuity, not just the range. The range may not exist. The range strongly depends on the choice of domains that will change through the lifecycle of a deposit. Trend modeling and compositing change the range significantly. These considerations reinforce that the range should not be used to determine the search radius, the drill hole spacing or classification criteria.
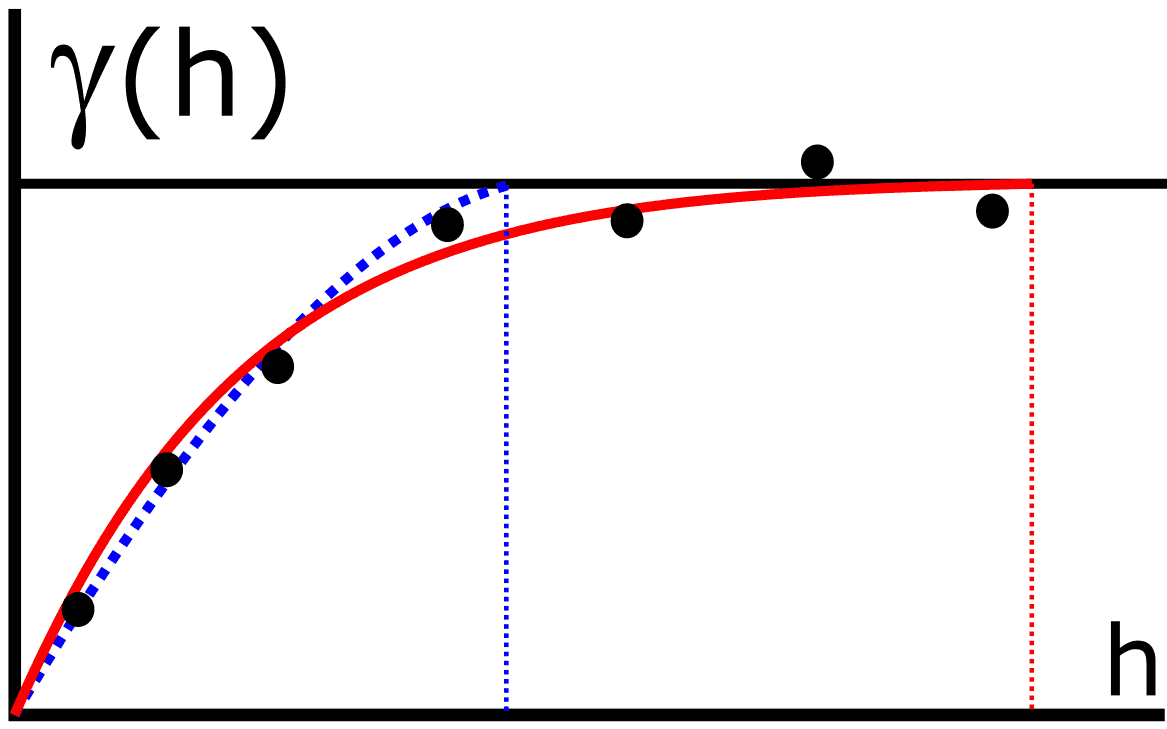
The range is very sensitive to modeling choices and the number of structures employed in modeling. The next figure shows two different variogram models for the same experimental points. The model fit is reasonable in both cases, but the ranges are very different. Different variogram modeling software or professionals could get very different ranges from the same data. In general, a larger range is modeled when more nested structures are used.
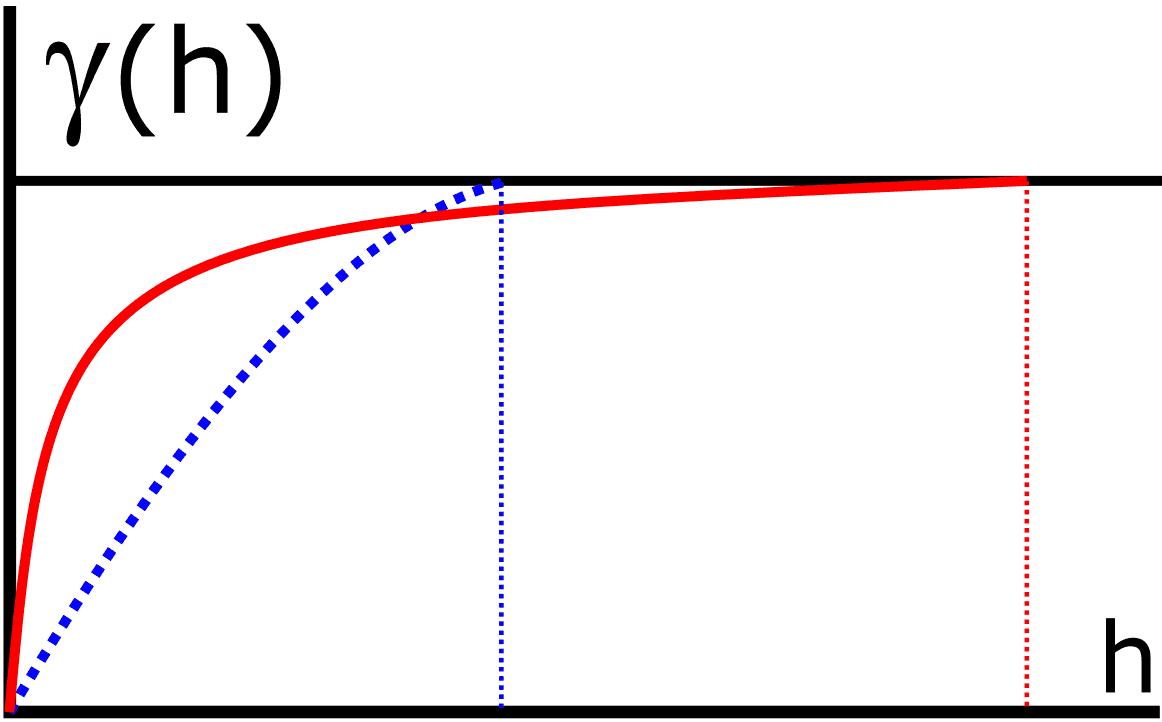
The variogram can approach the sill with different slopes. The next figure illustrates a case where a variogram with a long range represents a variable with less continuity. The short range variogram is much lower at practical short distance and represents a variable with more continuity. The entire variogram shape must be considered.
Considering a practical range, that is, the distance where the variogram reaches a fraction of the sill variance may mitigate modeling sensitivity and the variogram shape. The appropriate fraction of variance is likely between 80% to 90% of the variance, but the exact fraction is unclear.
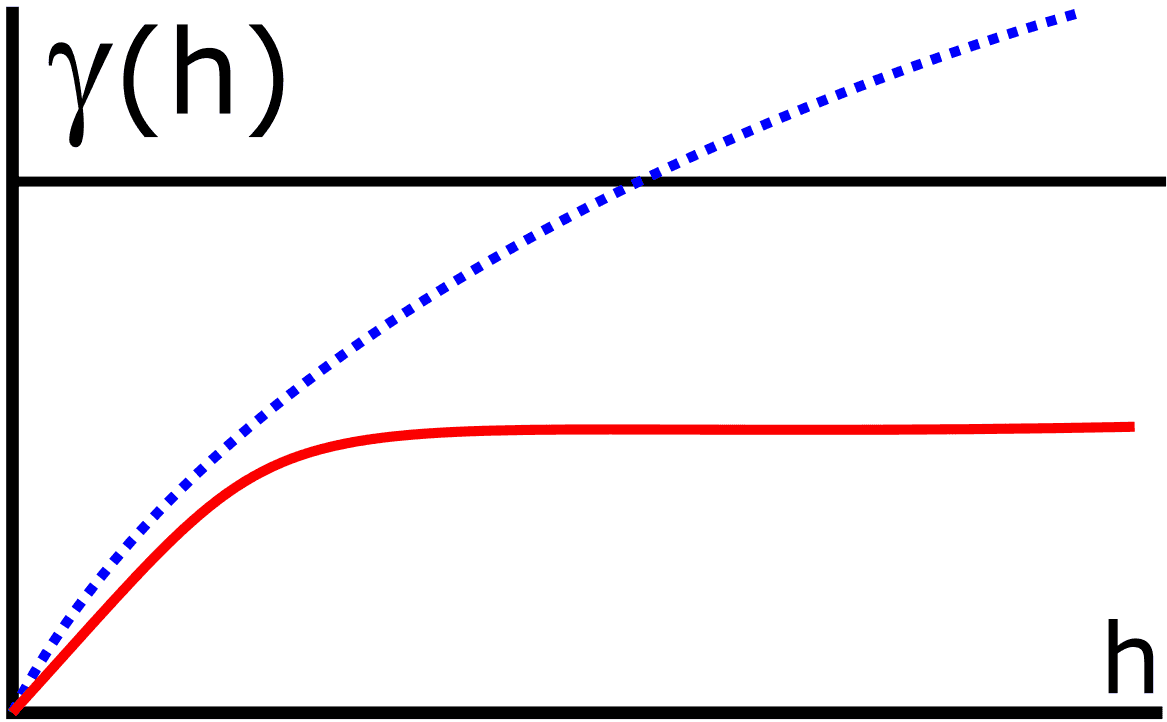
The range may not exist in presence of trends and zonal anisotropy. The next figure illustrates a common case of two principal directions showing different variograms: one with a trend going above the sill and one with a zonal anisotropy not reaching the sill.
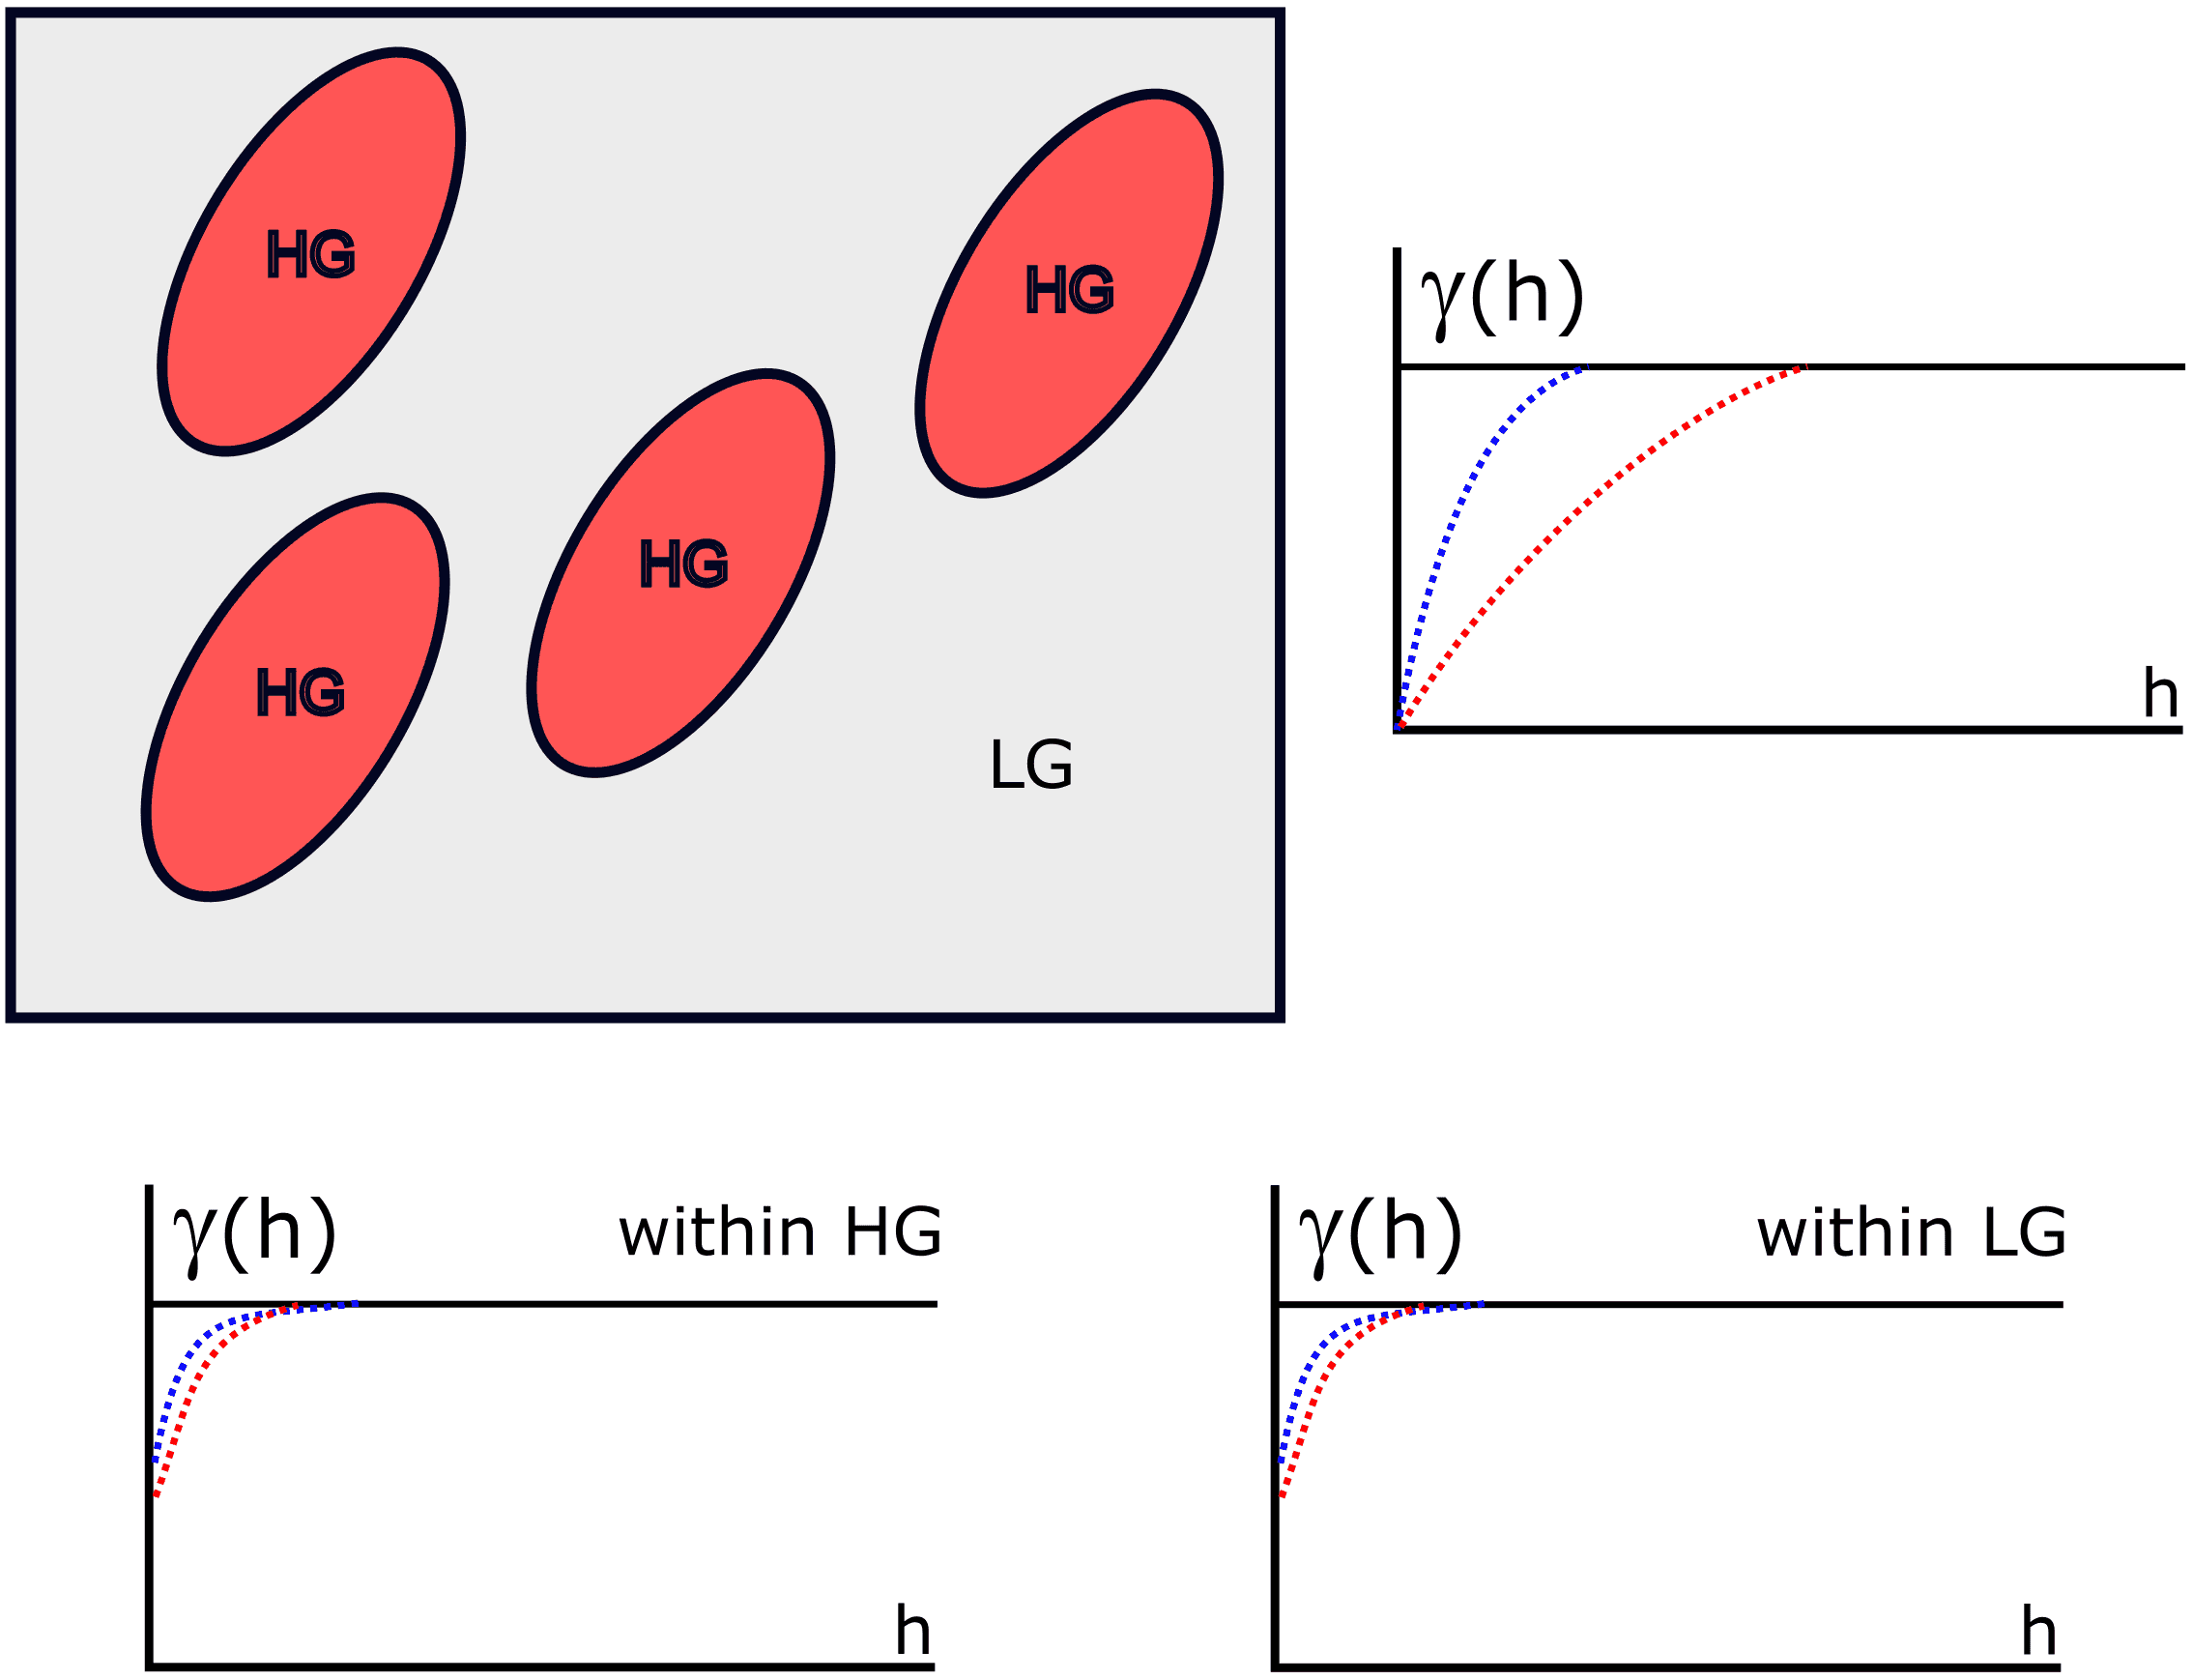
More precise geological domains lead to shorter variogram ranges. Domains are necessarily larger in presence of widely spaced data; therefore, the variogram range is almost always larger. The variogram range will decrease as the additional data become available and the domains are refined. The figure below illustrates this – the upper left is a sketch of high grade (HG) zones within a low grade (LG) background, the upper right shows the variogram for the entire area, the lower left shows the variogram for the HG zones and the lower right shows the variogram for the LG zone. The variogram is not an intrinsic feature of a deposit – it changes throughout the lifecycle of a deposit depending on the choice of domains.
The variogram range is further confounded when trend modeling and modeling with a trend is considered. The variogram of detrended variables does not show non-stationary features such as trends and zonal anisotropy, but has a significantly shorter range than the variogram of the original variable. Recent research into trend modeling (T. Mizuno) shows that detrended variables often have a variogram range between one to two times the drill hole spacing. Another complexity is that considering a trend may lead to a highly non-stationary residual where the range is shorter in regions of closely spaced data.
There are some other considerations. If the range exists, it is almost always anisotropic, that is, different in every direction. The variogram range also changes depending on the scale of the data. Compositing the data to a larger scale would, in general, lead to a larger variogram range.
Considering the ambiguity of the variogram range, it should not be used to define the search radius, drill hole spacing or classification criteria. Classification should be based on drill hole spacing considering mitigating factors and supported by an appropriate drill hole spacing study. The search radius should be specified to permit estimation of all blocks that meet the chosen classification criteria. The classification could be based on search passes, but considering the drill hole spacing is more transparent and straightforward. Blocks with even larger drill hole spacing may be estimated for internal assessment, that is, we could estimate blocks a large distance from the drill holes if we understand they are highly uncertain. Multiple search passes are specified so that the smoothness of the estimate can be calibrated correctly for volumes of different drill hole spacing. The search passes are not directly related to classification; however, the QP/CP could use the search passes in lieu of the drill hole spacing. Decisions related to the search and classification should not be based on the variogram range.
Resource Modeling Solutions (RMS) provides the software tools and workflows to calculate, interpret and model variograms in a reliable and repeatable fashion. A search (or locally varying search) may be conveniently generated from a variogram to reflect representative anisotropy, while scaling its limits based on noted considerations. RMS also provides the ideal scripted environment for simulation and drill hole spacing studies.


